Supernova SN2026fvx: Amateur Spectroscopy of a Stellar Explosion
- Admin

- 7 may
- 3 min de lectura
On April 3rd, 2026, I acquired the spectrum of the supernova SN 2026fvx using a spectrograph based on a Star Analyzer SA100 diffraction grating adapted to operate with a 35-micron slit. The observation consisted of a sequence of 15 exposures of 300 seconds each, resulting in a total integration time of 1 hour and 15 minutes.
Although the Star Analyzer is commonly used in slitless configurations, in this case it was adapted into a slit spectrograph configuration, significantly improving the spectral resolution and stabilizing the wavelength calibration. The following image shows the appearance of the stacked spectrum obtained after processing.

It is interesting to note the strong sky contamination caused by light pollution in the urban area of Majadahonda, where the observation was carried out. The use of a slit makes it possible to identify this contribution and subtract it from the object spectrum.
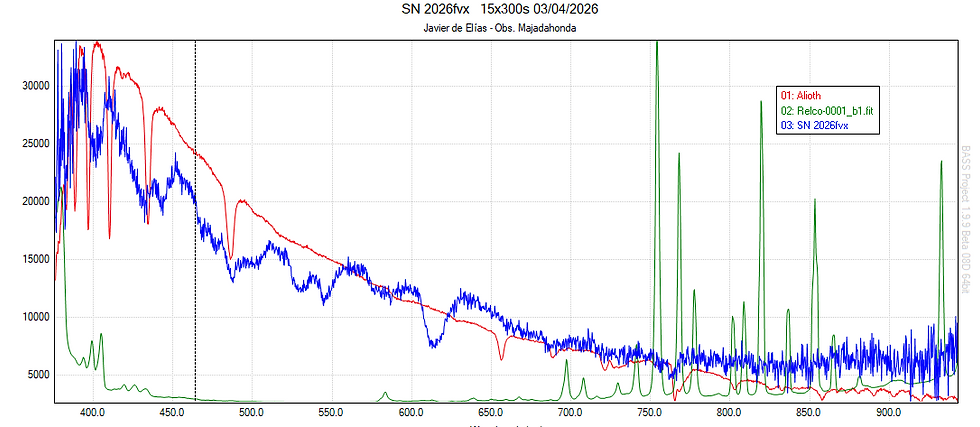
The spectral calibration was performed using a Relco lamp, while the star Alioth was used as a reference to correct for instrumental response and atmospheric extinction. This step is essential in order to approximately reconstruct the true spectral distribution of the observed object and to analyse both the continuum and the absorption spectral lines. The following figure shows the spectra of the supernova, the reference star, and the calibration lamp.
The supernova was located in the galaxy NGC 4205, situated approximately 57 million light-years away in the constellation of Draco. The obtained spectrum immediately revealed that it was a supernova extremely rich in metallic absorption lines, a typical characteristic of a Type Ia supernova.
One of the most important features identified was the deep absorption line of ionized silicon Si II around 635 nm. This line is essentially the “spectral signature” of Type Ia supernovae and appears shifted due to the enormous expansion velocity of the material expelled in the explosion. In the obtained spectrum, the absorption appeared shifted to approximately 614 nm, indicating radial velocities on the order of 9700 km/s.
In addition to silicon, the spectrum showed multiple absorptions associated with ionized iron Fe II, magnesium Mg II, and ionized sulfur S II. The latter formed the well-known “double depression” or “sulfur W”, another characteristic feature of this type of thermonuclear explosion.

The spectroscopic analysis also showed the absence of hydrogen Balmer lines, which constitutes another fundamental indicator for classifying the object as a Type Ia supernova and distinguishing it from core-collapse supernovae.
The spectral continuum could be reasonably approximated by a Planck curve corresponding to a temperature close to 12000 K, consistent with a relatively early-stage supernova after the explosion. At these temperatures, the spectrum is dominated by an intense thermal continuum on top of which the broad absorptions generated by the rapidly expanding outer layers are superimposed.
The width of the lines also provided information about the velocity dispersion within the ejecta. From the full width at half maximum (FWHM) of the main silicon line, a velocity dispersion close to 2900 km/s was estimated, indicating a highly dynamic and three-dimensional explosive structure.

From an astrophysical point of view, all these results are consistent with the classical Type Ia supernova scenario: the thermonuclear explosion of a carbon-oxygen white dwarf after approaching the Chandrasekhar limit. In these explosions, nuclear fusion rapidly progresses from light elements to intermediate-mass elements and finally to the iron group, releasing an enormous amount of energy that completely destroys the star.
One of the most interesting aspects of the spectrum is precisely how it allows us to “read” the nucleosynthesis layers of the explosion. The silicon and sulfur lines indicate regions where nuclear burning was incomplete, while the abundance of iron points to zones where nucleosynthesis reached iron-peak elements. In a certain sense, the spectrum constitutes a chemical snapshot of the different layers expelled during the explosion.

It is particularly remarkable that a spectrum with this level of detail can be obtained using amateur instrumentation based on a Star Analyzer SA100. This type of observation demonstrates how amateur astronomical spectroscopy can provide scientifically valuable results when aspects such as calibration, instrumental stability, and signal-to-noise ratio are carefully controlled.


Comentarios